


RANGER Device Page
RANGER Settings
Select a RANGER from the list on the Home tab to see the device status, sensor readings and settings. The detail display is organized as a “tile” view with each tile representing a specific input or function. Each tile with configurable settings has a “Configure” button that will bring up the related settings.
Node Status Tile
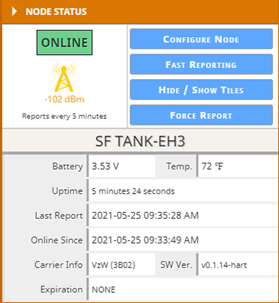
The Node status tile contains general information about the RANGER and allows setting the RANGER system parameters.
Force Report
Causes the RANGER to take a new sensor reading and send the data to the server on its next “ping” interval. This can take up to 40 seconds.
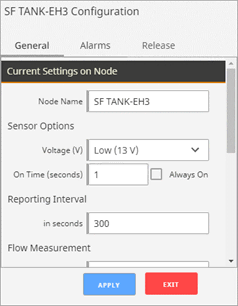
Node Name
The Node name is a user configurable string used to easily identify the RANGER.
Report Interval
The setting controls the interval at which the RANGER will apply power to the attached sensor and forward the sensor readings to the Cloud. Clicking on “Settings” will open up the Fast Reporting Interval window.
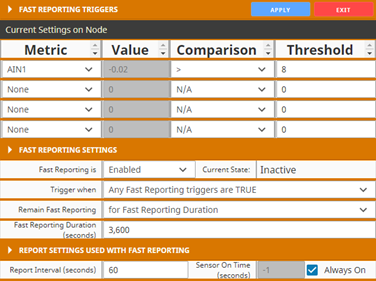
The RANGER can be configured such that if certain inputs cross a threshold, the RANGER will temporarily update at an increased rate. Fast Reporting can trigger when one or all conditions are met and can stay on for the entire time the input(s) are above the threshold, or a set time. In the above example, if Analog Input 1 goes above 8mA, the RANGER would begin reporting its sensor values every 60 seconds, for 3,600 seconds (1 hour).
Sensor Voltage
Sets the output voltage applied to the analog sensor output. It is user configurable to 13V or 18V.
Sensor on time
Configures the amount of time the Sensor Voltage is applied to the sensor prior to taking the reading. This needs to be long enough for the attached sensor to power on and stabilize, but should be minimized to optimize battery life. If the RANGER is not powering a sensor or if the sensor is powered externally, set this value to 0 to save battery life.
Flow Measurement
By default, the digital inputs report input state (open/closed) and input frequency. Optionally one or both digital inputs can be configured for Flow Measurement Mode. This is used for connection to a flow meter with a pulse output and allows the user to configure a pulse k-factor and see the flow rate and total in volume units. The analog inputs can also be used for flow measurement, where a current/voltage corresponds to a flow rate. The RANGER can sample the analog input at the report time only and do a rough approximation of a flow total by assuming that the flow rate stays constant between report samples. Note that there will always be some inaccuracy when using an analog input for flow totalization. A digital pulse it recommended whenever possible for best accuracy and low power operation.
The Alarm Group ID
This defines which alarm group will receive alarms from this device. Each user configured in the Users tab can be assigned an alarm group number. Any users with a matching alarm group will receive alarms from this RANGER. Multiple alarm groups may be entered separated by commas and all groups entered will receive alarms.
Offline Alarm
The RANGER will send an alarm if the device is offline for more than the configured ‘Offline Threshold’ setting.
Release
If the RANGER has been added to the wrong group and needs to be claimed under a different group, the RANGER can be released through the Release tab of the “Configure Node” window.
Analog Input Tile
 |
 |
The Analog input tile displays the details for the analog input, including scaling and alarms. If the 2AI/1DI expansion card is installed, “Sensor A” and “Sensor B” on the card will appear as their own Analog Input 2 and Analog Input 3 tiles, respectively.
Analog Mode
This will display the input mode (4-20mA or Voltage) that is set by the physical slide switch on the RANGER. When the switch is set to voltage mode, the user can select from the following input ranges:
| Voltage |
|---|
| 0-5V |
| 1-5V (default) |
| 0-10V |
| 0-15V |
| 0.5-2.5V |
Scale Units
This is a user definable string to identify the engineering units.
Scale Low / Scale High
The scaling allows the user to span the analog sensor. The Scale low is the sensor value at 4mA/low voltage point and the Scale High is the sensor value at 20mA/high voltage point.
Alarm Thresholds
The analog input supports a high and/or low alarm threshold. This threshold is configured using the scaled engineering units. If the configured threshold is crossed and the alarm is enabled, a SMS and/or email message will be sent to each user in the alarm group of the RANGER.
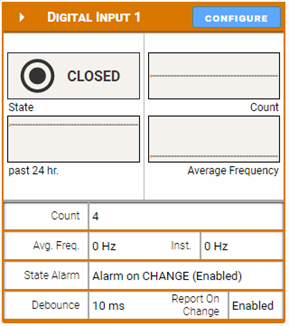
Digital Input Tile
 |
 |
There is a Digital Input tile for each of the two digital inputs, unless they are configured for Flow Mode. If the 2AI/1DI expansion card is installed, it will appear as its own Digital Input 3 tile.
Reset Counter
Selecting this check box and click apply will zero the input cycle count.
Report on Change
If selected, the RANGER will report any changes on state of the input to the Cloud within 2-seconds rather than waiting until its next scheduled report.
DIN Alarm
The RANGER can send an alarm when the DIN opens, closes or on any change.
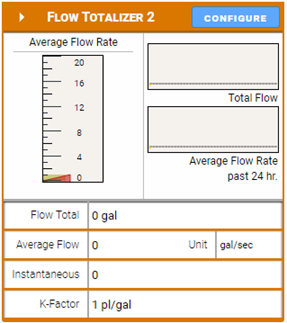
DIN Flow Totalizer Tile
 |
 |
If a digital input is configured for Flow Mode, the flow totalizer tile will replace the default Digital Input tile. When in flow mode the RANGER will display the flow rate and total flow volume. The Average Flow is the average flow rate over the configured RANGER Report Interval, while the Instantaneous Flow rate is the flow rate calculated over the 2 seconds immediately before the report.
Flow K-Factor
Enter the number of pulses per unit volume that the flow meter outputs. The volume pulse units can be selected.
Volume Units
The Volume Units is used to select the volume units to use to for the flow rate and total volume calculations.
Time base Units
The Time base units select the time units for the flow rate calculations.
Set Flow Total
This allows the user to set or reset the total volume measured. Click the checkbox then enter the volume.
GPS Tile
 |
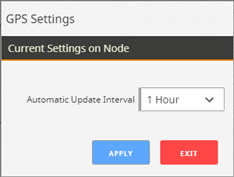 |
The RANGER has an internal GPS receiver/antenna to provide location data to the server. The RANGER requires a clear view of the sky for the GPS functionally. GPS will often not work inside even if the RANGER is near a window. A GPS update may be triggered on demand, or an automatic location update interval between 1 and 12 hours can be configured. For an on-demand location update, click the “UPDATE” button. Note that an initial “cold” GPS fix may take up to 5 minutes. While the GPS receiver is active commands sent to the RANGER my take up to 80 seconds to be delivered.
Digital Output Tile
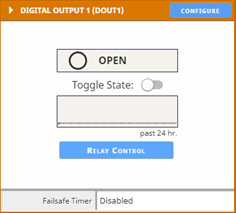
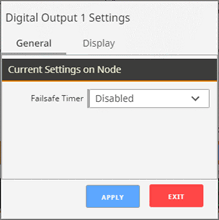
The relay output can be toggled by setting the Toggle State switch. The command will reach the RANGER on its next “ping” interval which can take up to 40 seconds. The Toggle State switch will change to blue and the OPEN/CLOSED indicator will change once the message has reached the RANGER . The relay output also has an optional failsafe timer. If this is configured, the relay will go to the open (failsafe) state if the RANGER loses connection to the server for the configured time.
Relay Control
The digital output on the RANGER can be configured to energize and de-energize based on its other inputs. This control logic is run locally in the RANGER and does not depend on cellular connectivity. First, the “Relay Control” field should be Enabled. The trigger logic can be entered by specifying which input to control the relay from, and then specifying which values of that input energize and de-energize the relay. If the relay is being triggered from multiple inputs, the user can select whether all the triggers need to be true (Boolean AND), or any of the triggers need to be true (Boolean OR). The Minimum Energize Time field determines the amount of time the relay, once energized, will stay on even if the de-energize condition becomes true.

Modbus Tile

If the RANGER has the Modbus expansion card installed, users can configure the RANGER to read Modbus registers from any attached sensors. To set the RS-485 communication parameters and configure Modbus reads, click on the “Configure” button on the Modbus tile.
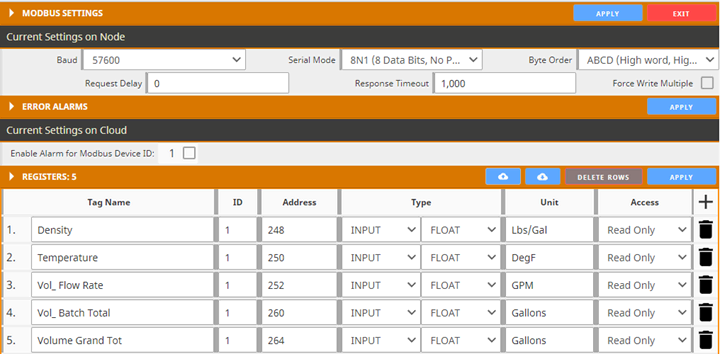
Use the top portion of the menu to configure communication parameters. These settings must match all the sensors on the RS-485 multidrop network. The default configuration is shown in the figure above.
The RANGER can read up to 32 datapoints from up to 8 connected devices. To add a new register read, click on the ‘+’ button. Each line needs to be specified with a Tag Name, and point to a Modbus Slave ID, register type, register address, register data type (INT16, UINT16, INT32, UINT32, INT64, UINT64, FLOAT, DOUBLE, or BIT), and read/write access. The register can also be tagged with units if needed. Click Apply to send the changes to the RANGER .
The RANGER can read individual bits of a 16-bit register. This can be useful for bitmask registers where each bit position represents a flag/status alarm. To select the bit, change the Type to “Bit Pos” and then the bit position number. Bit Pos 0 reads the Least Significant Bit, and Bit Pos 15 reads the Most Significant Bit of a 16-bit register.
To select lines for deletion, click on the trash can icon at the end of each line, and then click on the “Delete Rows” button to delete all the rows selected.
Optionally an alarm can be enabled per Modbus ID that will send an alarm if one or more of the register requests fails for any reason from that Modbus ID. This is useful to alarm on loss of communication with the end Modbus device.
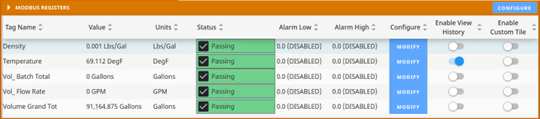
Once the registers have been set up as desired and applied, click “Exit” to return to the RANGER’s main page. The registers and their values will appear in a table below, where they can be organized in ascending or descending order by clicking on each header. The Modbus register configuration can also be done locally using the RANGER ToolKit.

Clicking on the slider for “Enable View History” will add that register to the historical data view at the bottom of the page. Clicking on “Modify” will bring a pop-up to configure alarms, or to do a register write to set a Modbus value in a register. Every register can be individually set up with Low and High alarm thresholds. Click “Apply” to save alarm settings for each register.
Clicking the “Modify” button on the register you want to change brings up the following dialogue.
You can enter the Register Value and click SET. This will write that register to your MODBUS device.
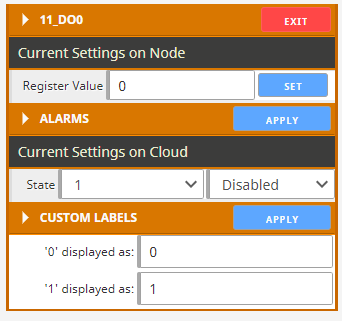
Clicking on the slider for “Enable Custom Tile” will make that metric viewable as a tile similar to the analog and digital inputs.
HART Tile
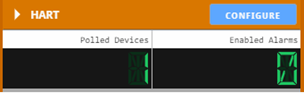

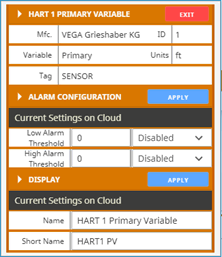
If the RANGER is configured with a HART expansion card, the HART tile will show up on its Cloud page. Clicking “Configure” on the HART tile will open a window that allows you to choose which devices the RANGER will read from by HART ID in the Enable HART IDs section. The Enable Communication Error Alarm for HART ID when enabled for a given HART ID will send an alarm if there is a communication failure between the RANGER and the attached HART device. As per HART protocol, the RANGER can read one device at HART ID 0, or up to 15 devices in multi-drop mode addressed 1 through 15. Note that if the RANGER is supplying power, each sensor requires an additional 4mA, and will drop the output voltage by 1V. The RANGER cannot supply more than 60mA total to all connected sensors (including 4-20mA/1-5V analog). Once the RANGER is set up to read HART transmitters, their variables will appear above the trend graph as shown below.
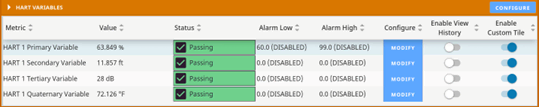
Clicking on the slider for “Enable View History” will add that variable to the trend graph. Clicking on “Modify” will create a pop up that allows the user to set a custom name, and trigger alarms from that variable.
SDI-12 Tile
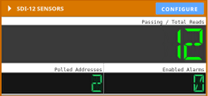
If the RANGER is configured with the SDI-12 expansion card, the SDI-12 tile will appear on its Cloud page. Click on “Configure” to set up the values for the RANGER to read. To add a line, click on the “+” button, and specify the value name, sensor address, SDI-12 request, and which position of the response to read in. To remove a line, click on the trash can icon followed by clicking “Delete Rows”. Hit Apply to set the lines, and the RANGER will begin reading the values specified in the table.
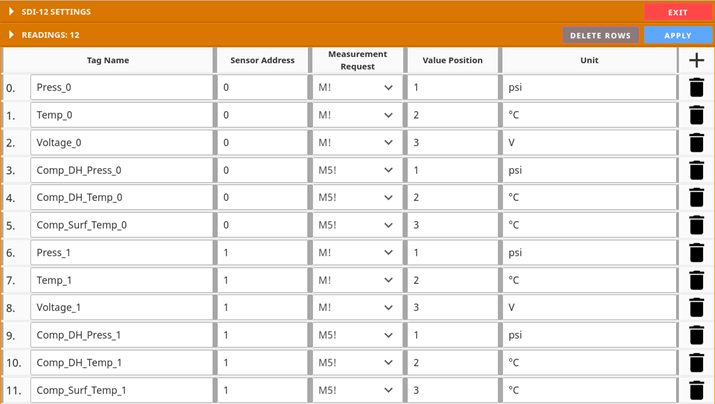
Once the RANGER begins reading, the values will appear on the RANGER ‘s page, below the tiles and above the historical trend view. Click on the “Modify” button to set up High and Low Alarms. Click the slider on “Enable View History” to have the value show up in the graph below.

Pressure Tile
Pressure Ranger Settings
Select a Pressure Ranger from the list on the Home tab to see the device status, sensor readings and settings.
The detail display is organized as a “tile” view with each tile representing a specific input or function. Each tile with configurable settings has a “Configure” button that will bring up the related settings.
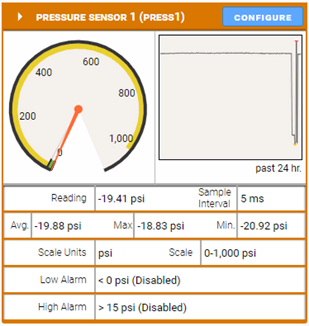
The Pressure tile displays the current pressure and range of the Pressure Ranger, as well as alarm and scale settings. To change these settings, click on the “Configure” button.
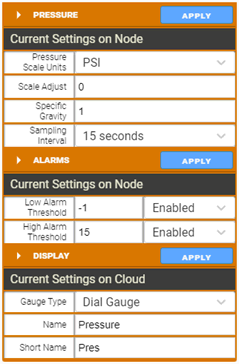
The Pressure section is used to change the pressure unit scale, the specific gravity, and sampling interval. The sampling interval can be either the report interval, or more rapidly between 5 and 60 seconds. The Alarms section is used to enable alarms. If the account is alarm enabled, alarms will be sent by text or email if the pressure goes below the low threshold or above the high threshold. The Display section is used to change the graphic and labels on the Pressure tile.
Pressure Scale Units
The Pressure Ranger supports many common pressure unit conversions that are available in the dropdown. Additionally, the user may select “Custom” and them provide a scale low and scale high value.
Scale Adjust
The value in the scale adjust will be added to the scaled pressure reading. For example, this is useful if the pressure is being used for tank level and the pressure source is offset from the bottom of the tank.
Specific Gravity
The scaled value will be multiplied by the specific gravity setting. For liquid level applications this value can be used to increase the accuracy of the level measurement.
Rapid Pressure Sampling and Report on Exception
If the Sampling Interval is set less than the report interval, the pressure will be sampled at this higher rate. The Pressure Ranger will report the maximum, minimum, and average of the pressure samples obtained over the configured reporting interval.
The Fast Reporting feature can be utilized to cause a report on exception if the pressure crosses a configured setpoint.
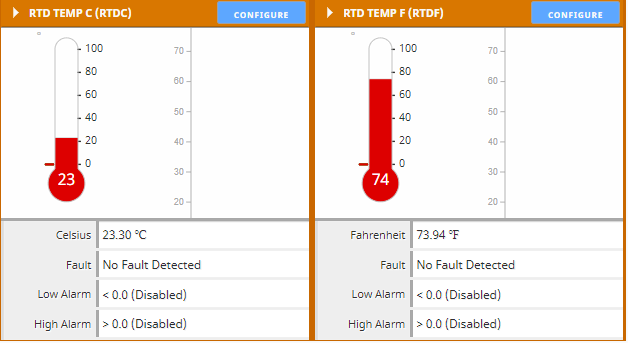
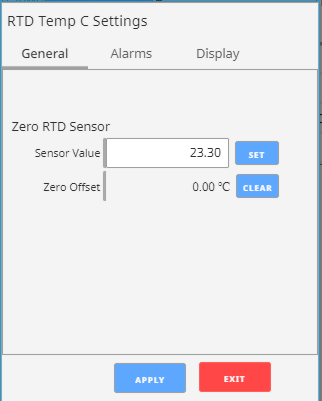
RTD Tile
When the RTD card is installed and enabled in the Ranger ToolKit, two tiles will become available on the SignalFire Cloud. RTD Temp C and RTD Temp F, so there is a separate tile for Celsius and Fahrenheit temperature values. The user can then configure alarms in their unit of choice. If desired, one of the tiles can be hidden by using the Hide/Show Tiles dialog.