


Dashboard Setup
Users can create custom dashboards that can display data from multiple Rangers on a single dashboard. Within each dashboard users can create groups to logically group data views. To create or edit a dashboard the user must have “Dashboard Admin” rights on their account.
Create Dashboards and Data Groups
- Select the “Dashboards” menu item, then click “Manage Dashboards” and then
click “Add a Dashboard” and enter a name for the custom dashboard and click
the “Rename” button to save. - Click the “+ Add Data Group” button to create your first data group and
click the edit button to edit this group. - Name the data group and click the “rename” button to save. Each dashboard can have multiple data groups

Add data points to Data Group
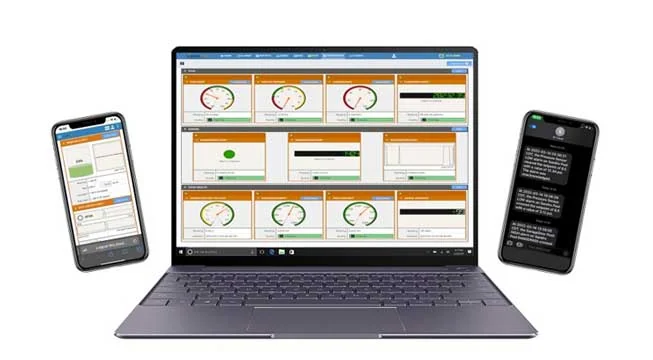
In each data group users can add data points one at a time or in bulk. To add a single data point, click the “Add Data Point” button. From here select the Ranger, metric and then the display type. The options for display type will vary depending on the metric type. Options include the Device tile which mirrors the tiles on each Ranger detail page, additionally there are other simple data views like a gauge, tank alarm status icon, or value display. Each tile will have a title bar indicating the Ranger name along with the Ranger connectivity status. If you want to add the same data point from multiple Rangers to a data group, click the “Bulk Add Data Points” button. Select multiple Rangers in the select device list by holding the Ctrl key. Once one or more Rangers is selected, a list of common metrics will be displayed in section. Select a metric then select the display type and click Save to Data Group to apply changes.